Introduction
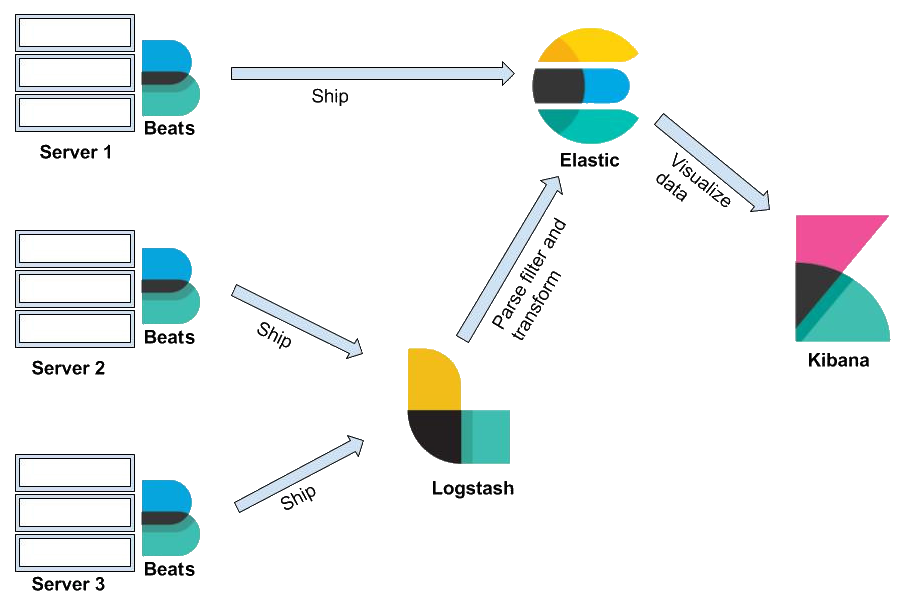
Elastic Stack, commonly known as the ELK Stack (Elasticsearch, Logstash, Kibana, and Beats), is a powerful suite of tools for searching, analyzing, and visualizing log and time-series data. The most commonly used combination today is Elasticsearch, Kibana, and Elastic Agent (which has replaced the need for Beats in many cases). These three components work together to provide scalable search, data indexing, and real-time insights. In this walkthrough, we will go through the steps involved in setting up Elasticsearch, Kibana, and Elastic Agent.
Set Up Elasticsearch
Add Server GPG key
curl -fsSL https://artifacts.elastic.co/GPG-KEY-elasticsearch |sudo gpg --dearmor -o /usr/share/keyrings/elastic.gpg
Update sources lists
echo "deb [signed-by=/usr/share/keyrings/elastic.gpg] https://artifacts.elastic.co/packages/8.x/apt stable main" | sudo tee -a /etc/apt/sources.list.d/elastic-8.x.list
Install Elasticsearch
sudo apt update
sudo apt install elasticsearch
Configure Elasticsearch
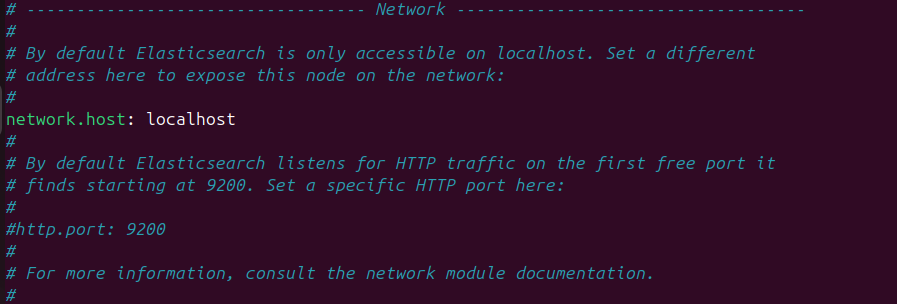
Elasticsearch’s configuration file is in /etc/elasticsearch/elasticsearch.yml
To make Elasticsearch listens on all interfaces and bound IPs uncomment network.host and replace its value with localhost
Start and Run Elasticsearch
Start the Elasticsearch service:
sudo systemctl start elasticsearch
Enable Elasticsearch to start up every time the server boots:
sudo systemctl enable elasticsearch
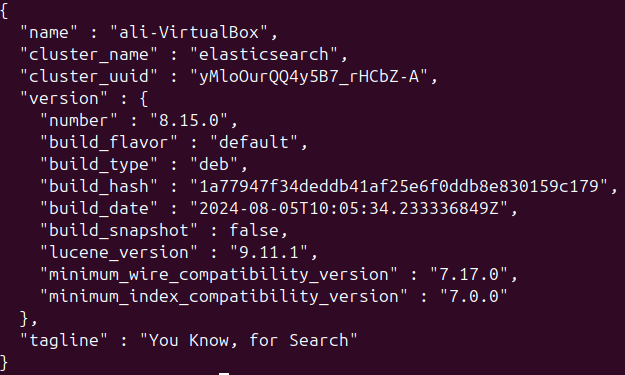
Check running by sending an HTTP request:
curl -X GET "localhost:9200"
Set Up Kibana
We have already added the Elastic package source above so we can install using apt:
sudo apt install kibana
Start and Run Kibana
Start the Kibana service:
sudo systemctl start kibana
Enable Kibana to start up every time the server boots:
sudo systemctl enable kibana
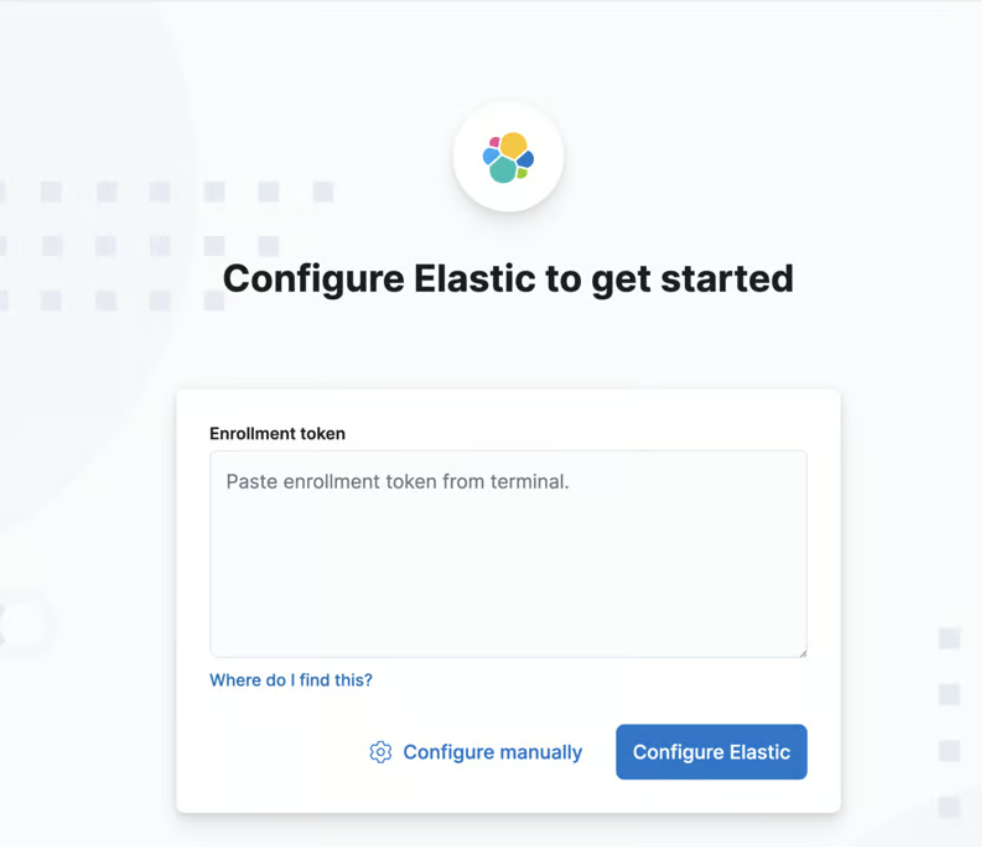
Open browser and write [localhost:5601]
 The
The elasticsearch-create-enrollment-token command creates enrollment tokens for Elasticsearch nodes and Kibana instances.
cd /usr/share/elasticsearch
sudo bin/elasticsearch-create-enrollment-token --scope kibana
 Enter the token then wait
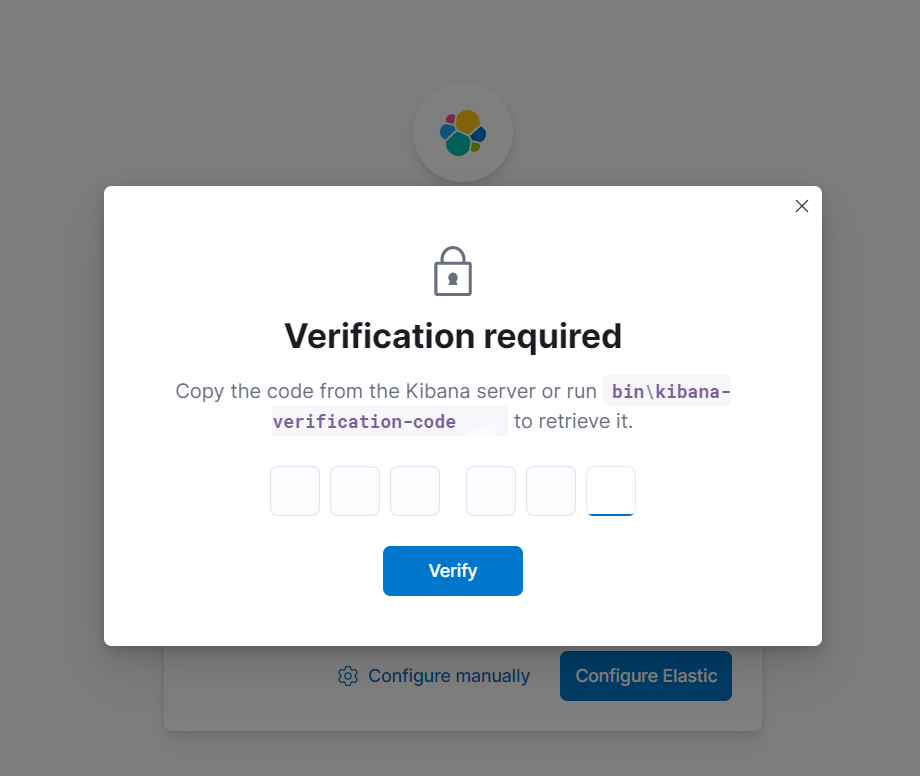 based on the popup run:
cd /usr/share/kibana
sudo bin/kibana-verification-code
 enter the generated verification code
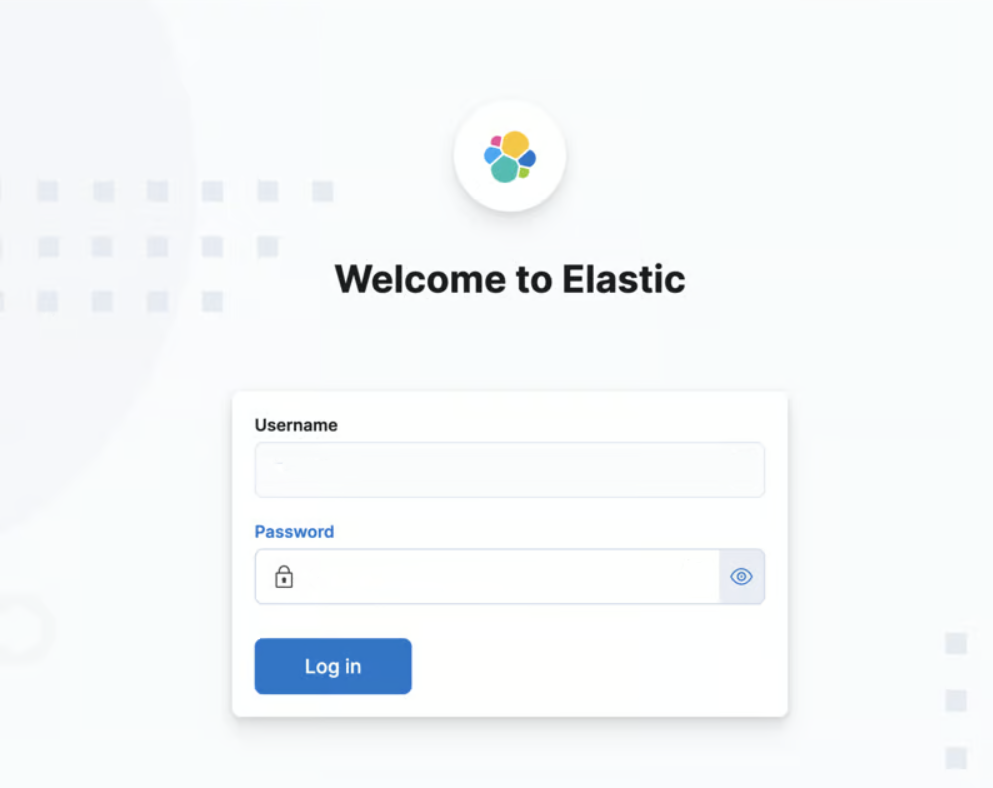
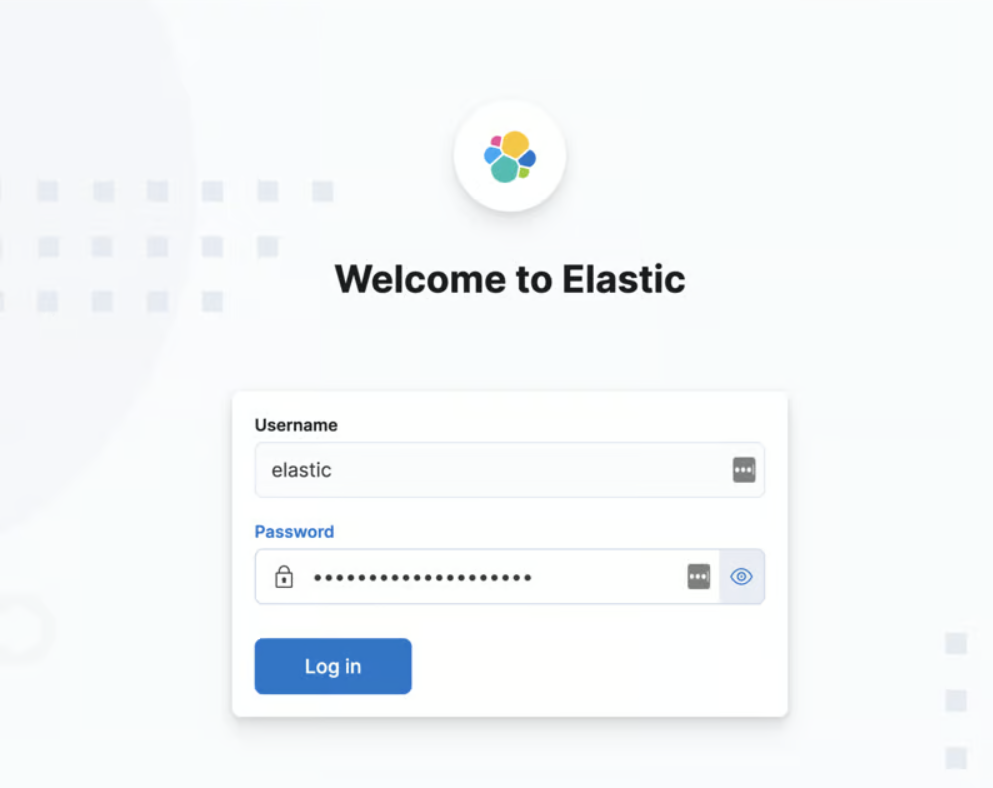
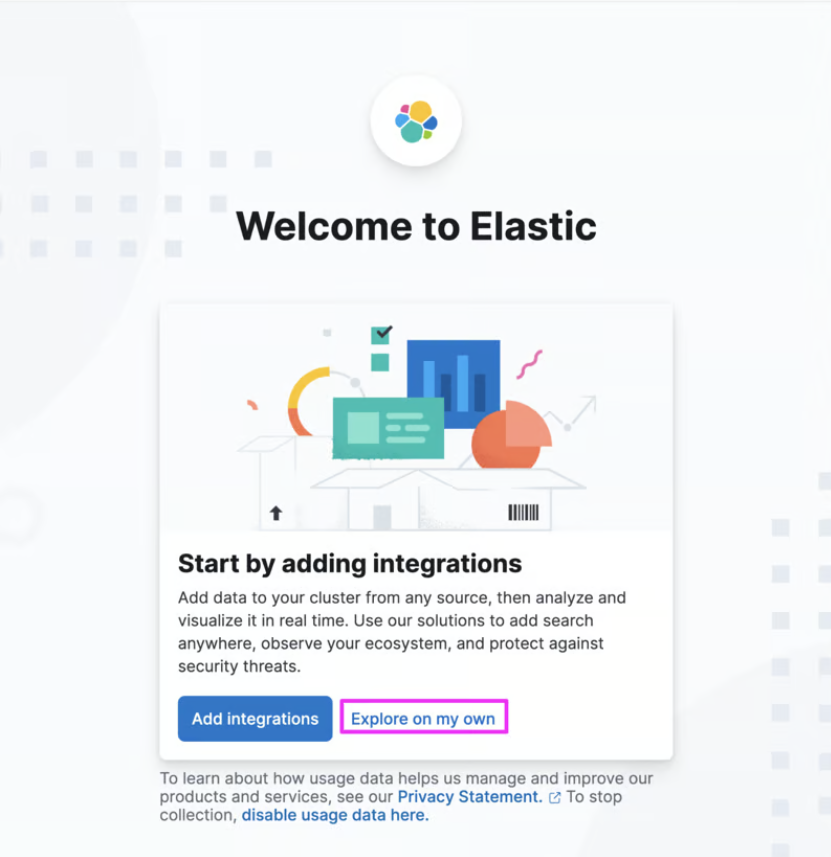
 When the set up completes, it displays the login page.
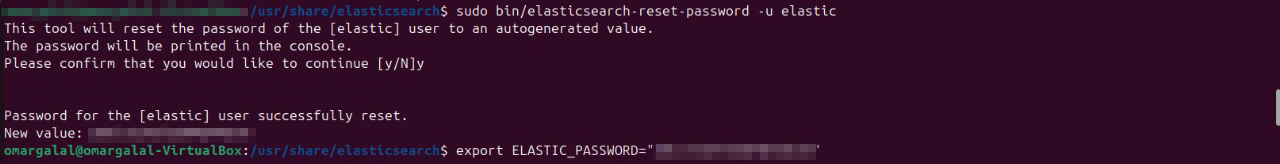
 to get
 elastic user new password :
cd /usr/share/elasticsearch
sudo bin/elasticsearch-reset-password -u elastic
export ELASTIC_PASSWORD="your_auto_generated_password"
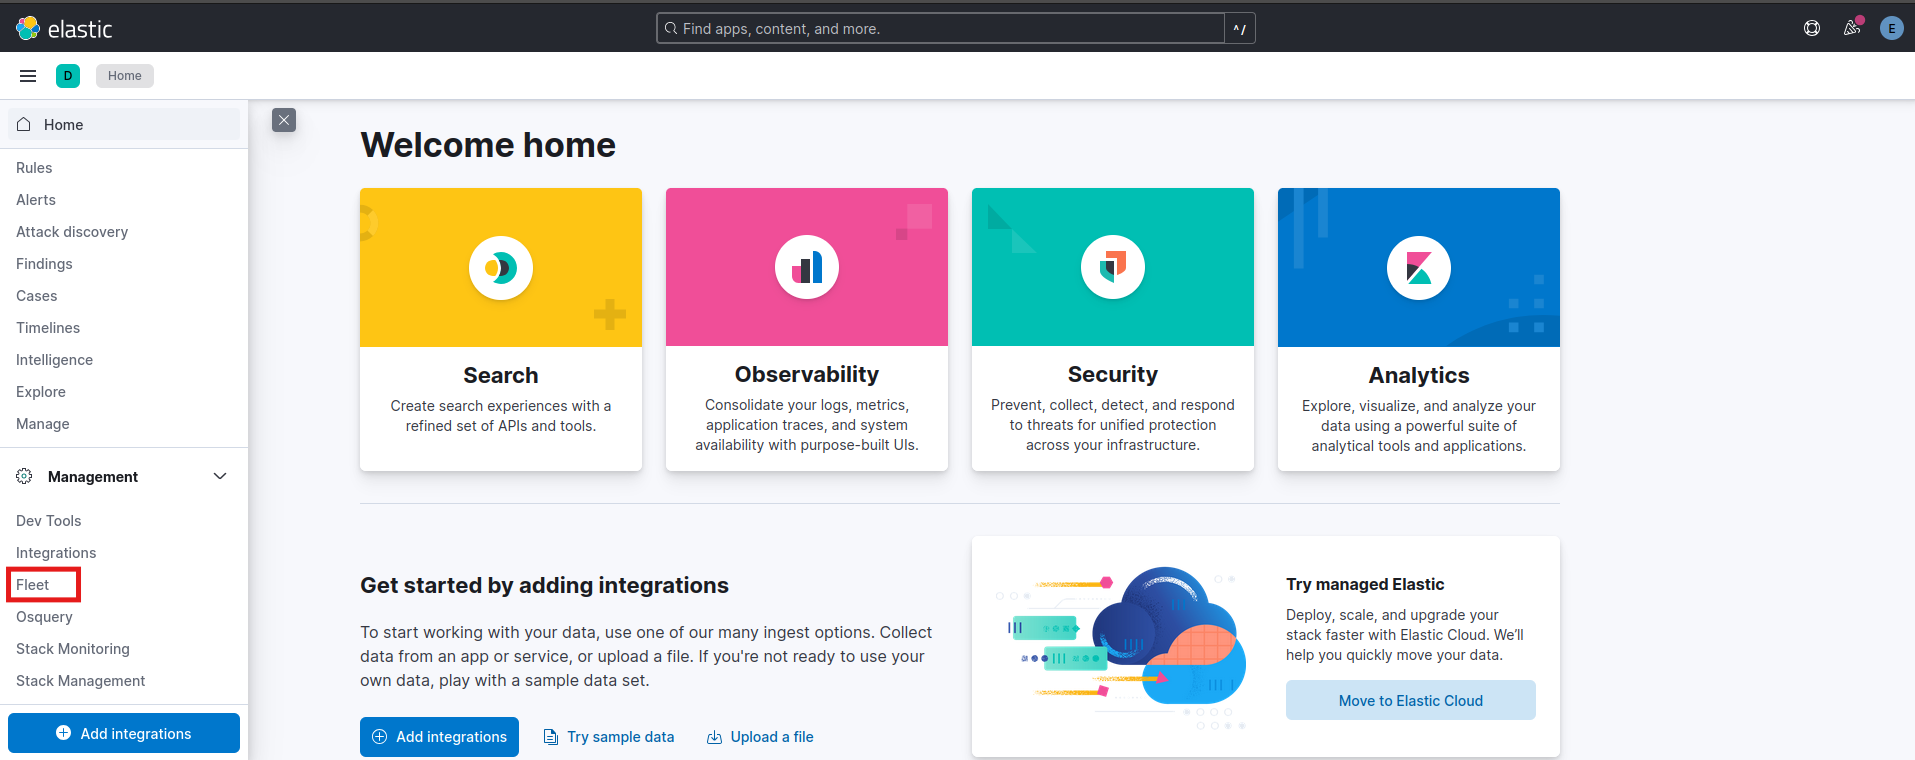
Set Up Elastic Agent
Set Up Fleet Server
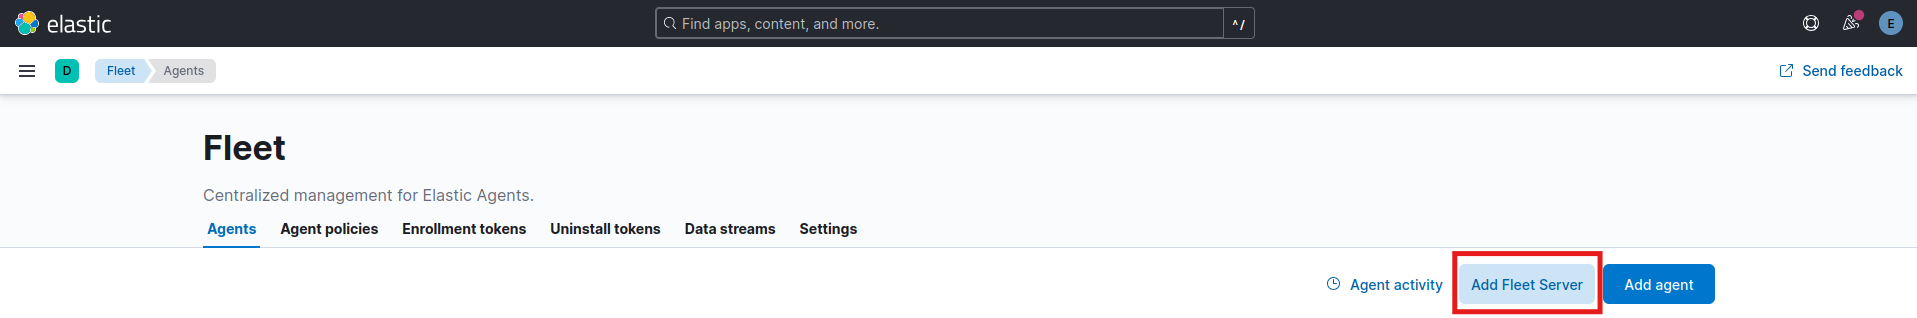
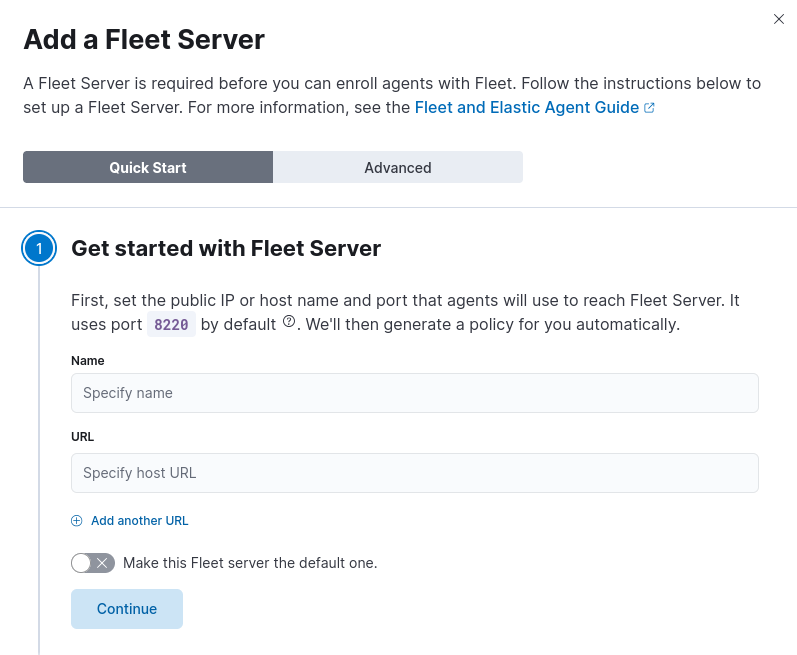 Name the fleet server and specify the host url with port 8220
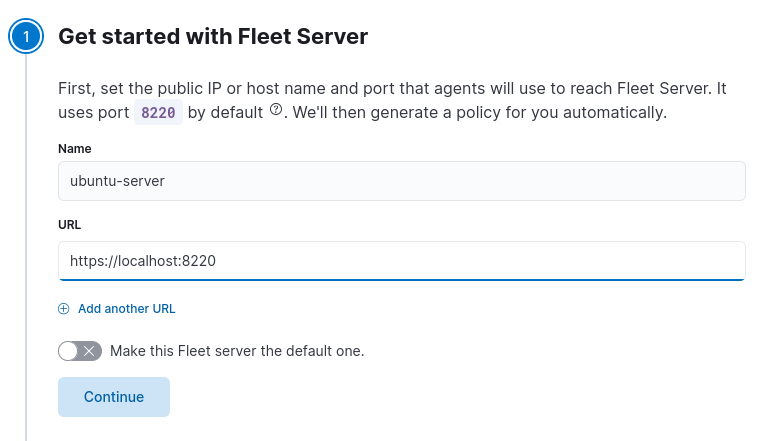
 we can use the same host of elasticsearch

Add Agents
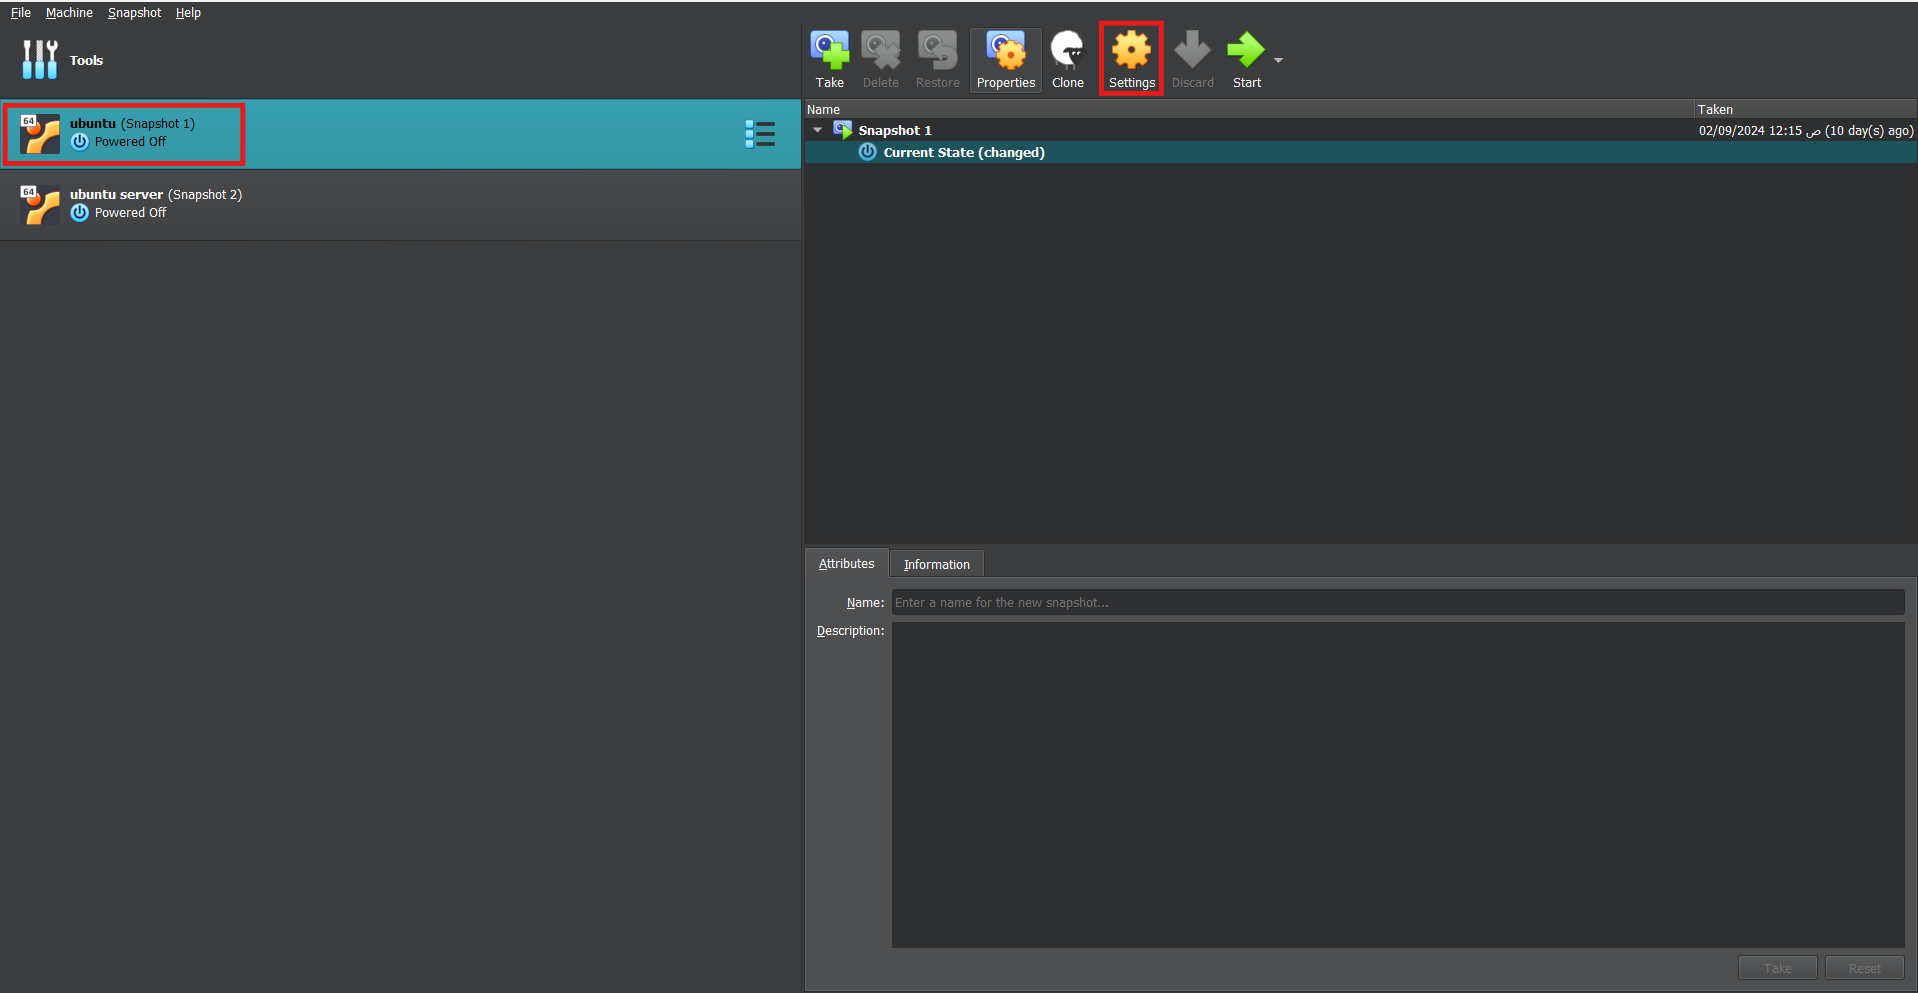
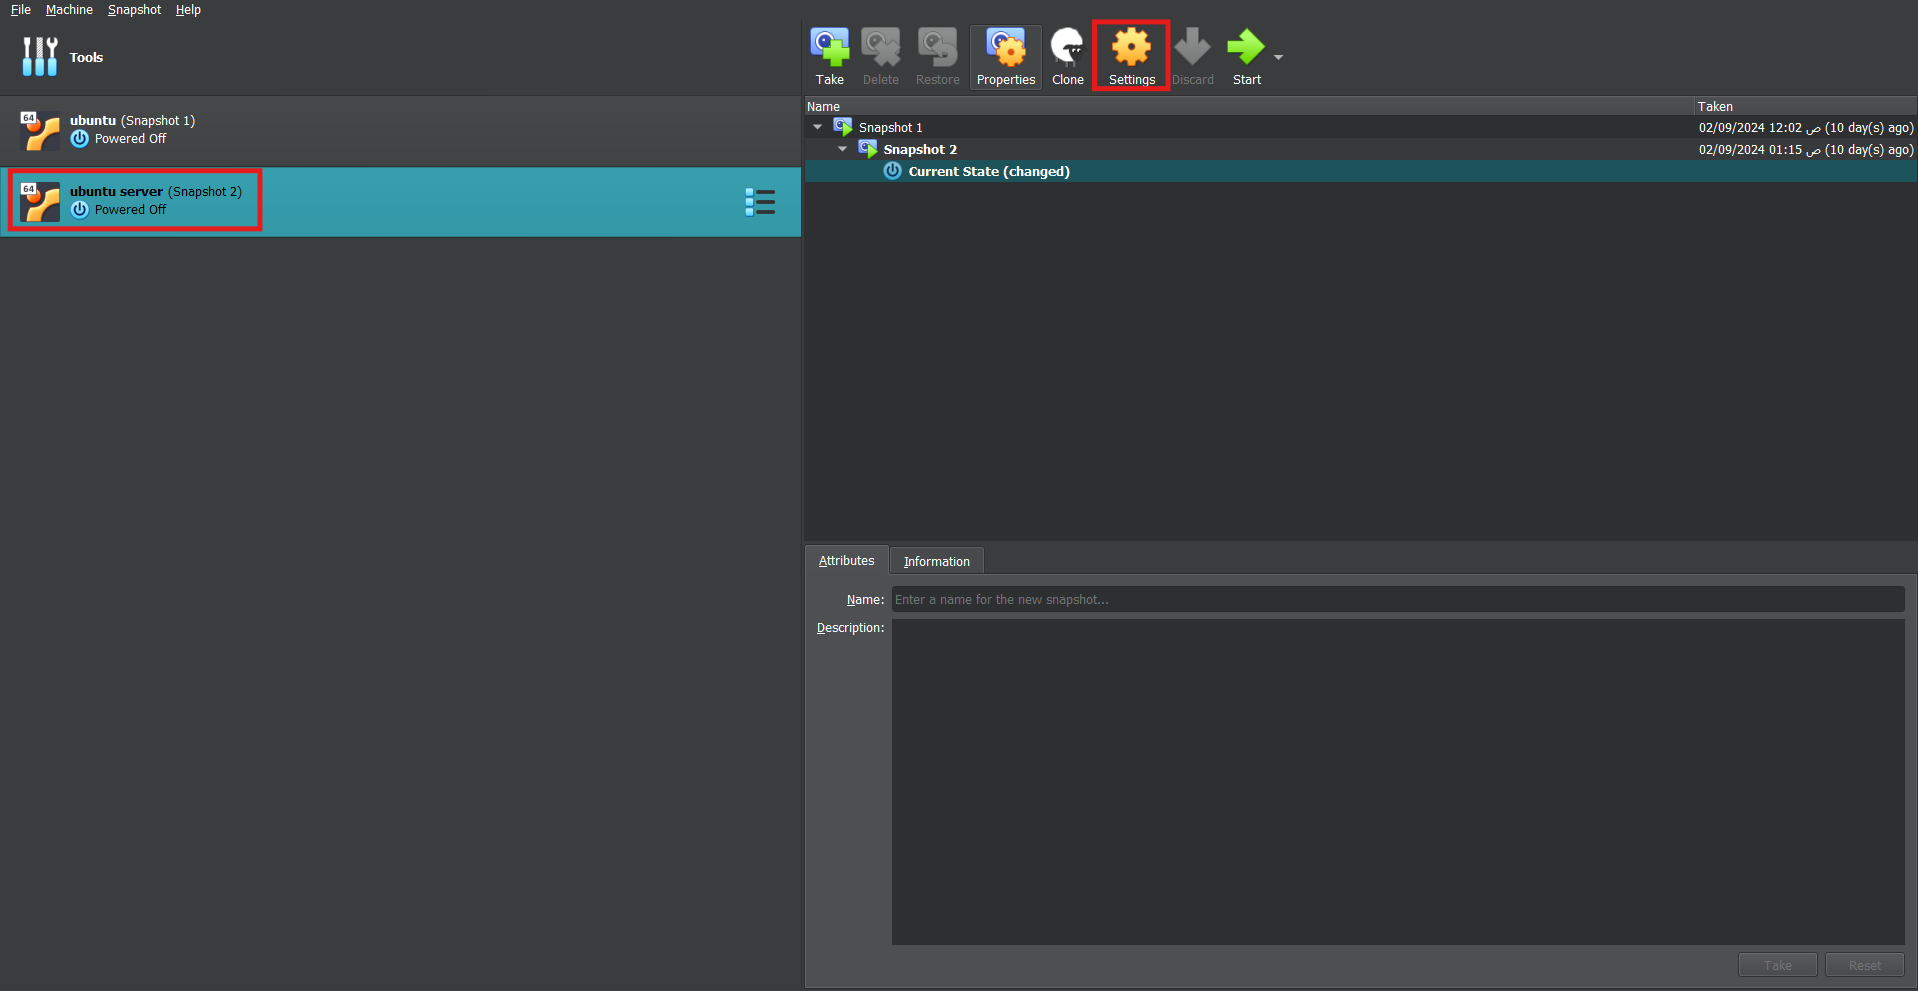
I installed another virtual machine running ubuntu server to install elastic agent and retrieve logs from it.
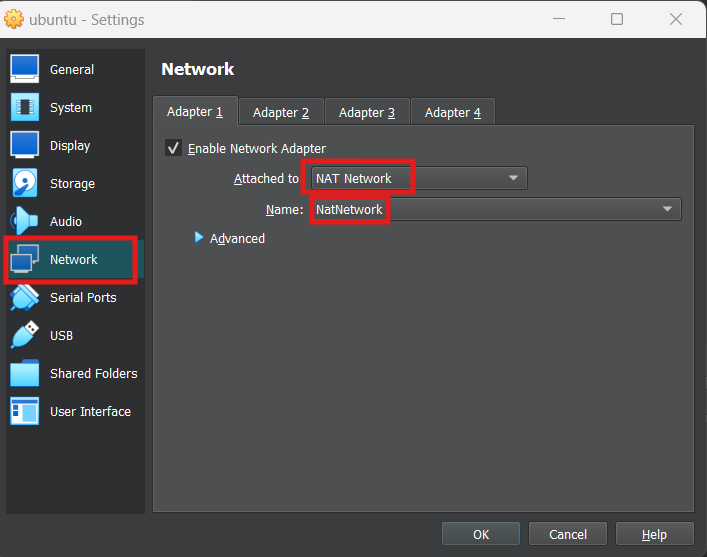
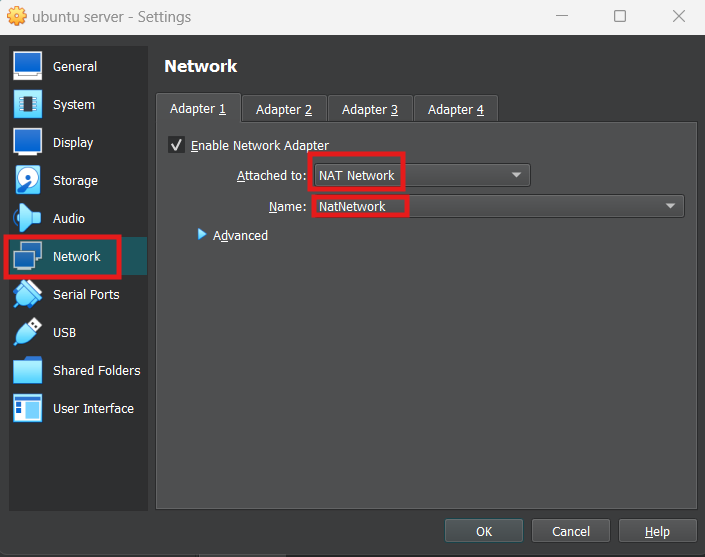
On Virtual Box I created a Nat Network by “Ctrl + H” to view network settings
 set both machines in the same Nat network by selecting each one and open Settings -> Network -> set Attached to Nat Network -> set Name to the created Nat network.
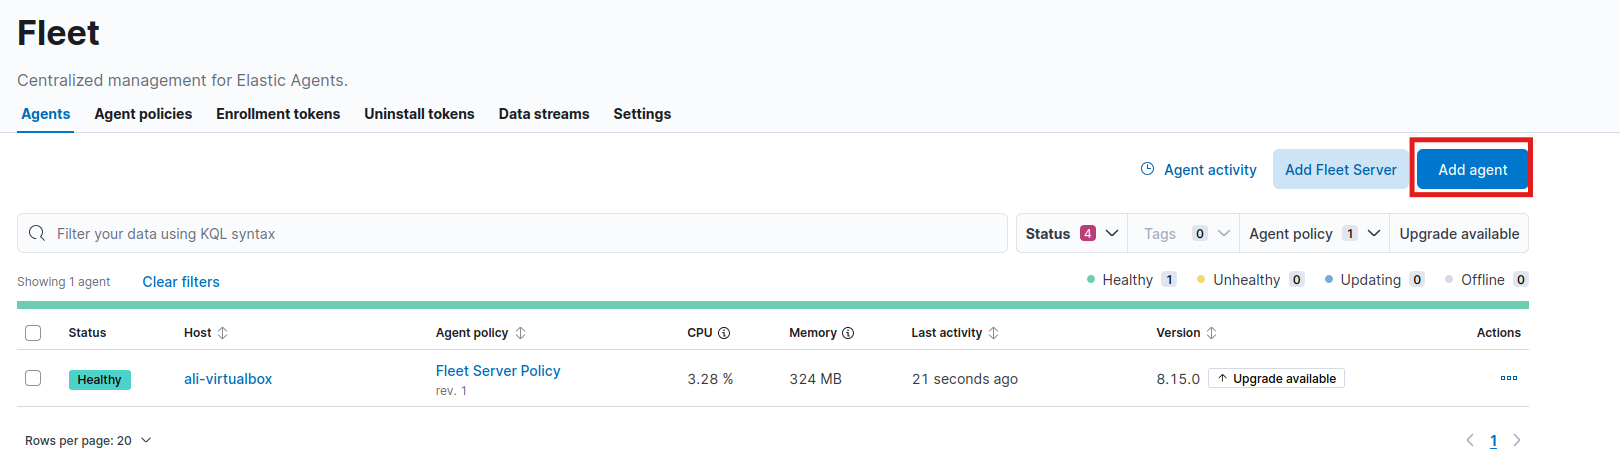
From fleet page click “Add agent”
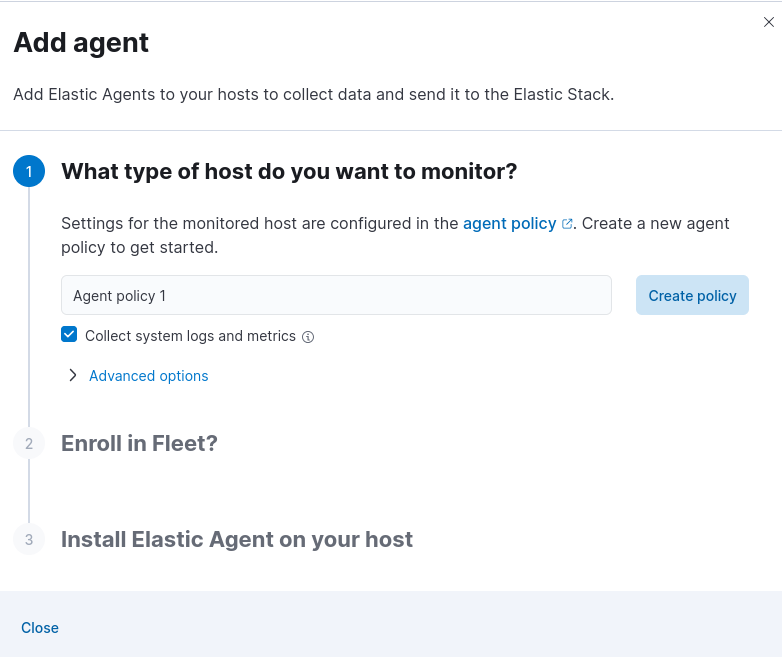
 Create a Policy
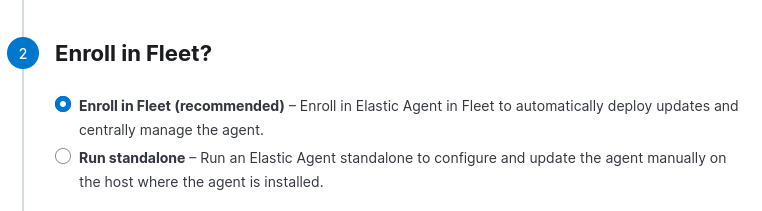
 Enroll in Fleet
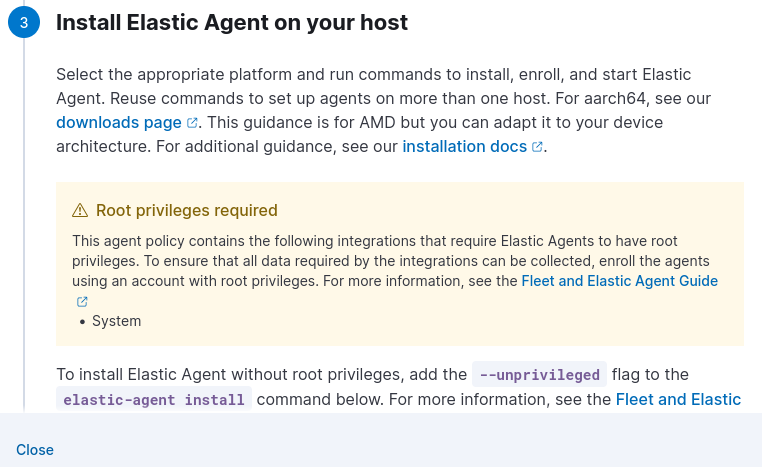
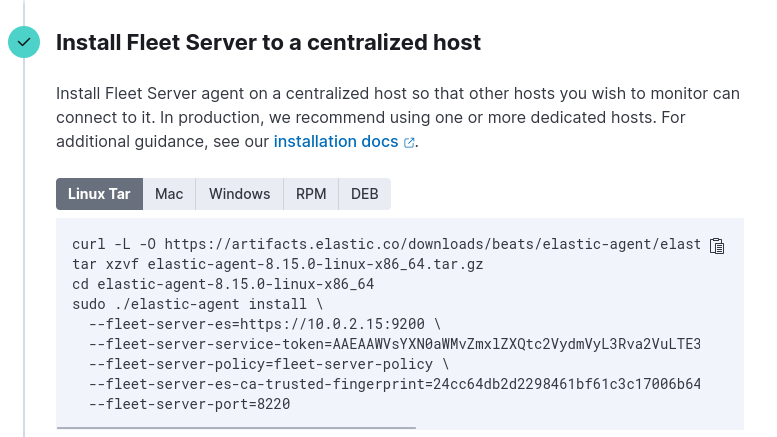
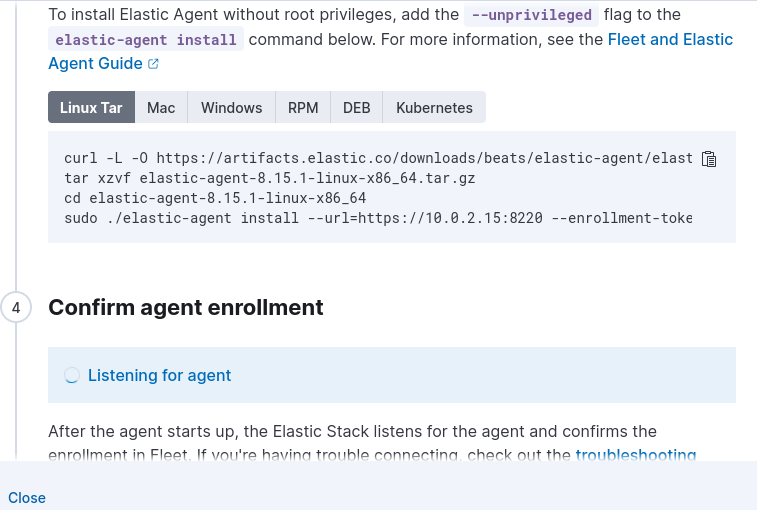 Following the installation guide on ubuntu server till the last command tweaked it to skip “certificate signed by unknown authority” error by adding
 --insecure:
sudo ./elastic-agent install --url=https://10.0.2.15:8220 --enrollment-token=your_generated_token --insecure
Wait Confirmation
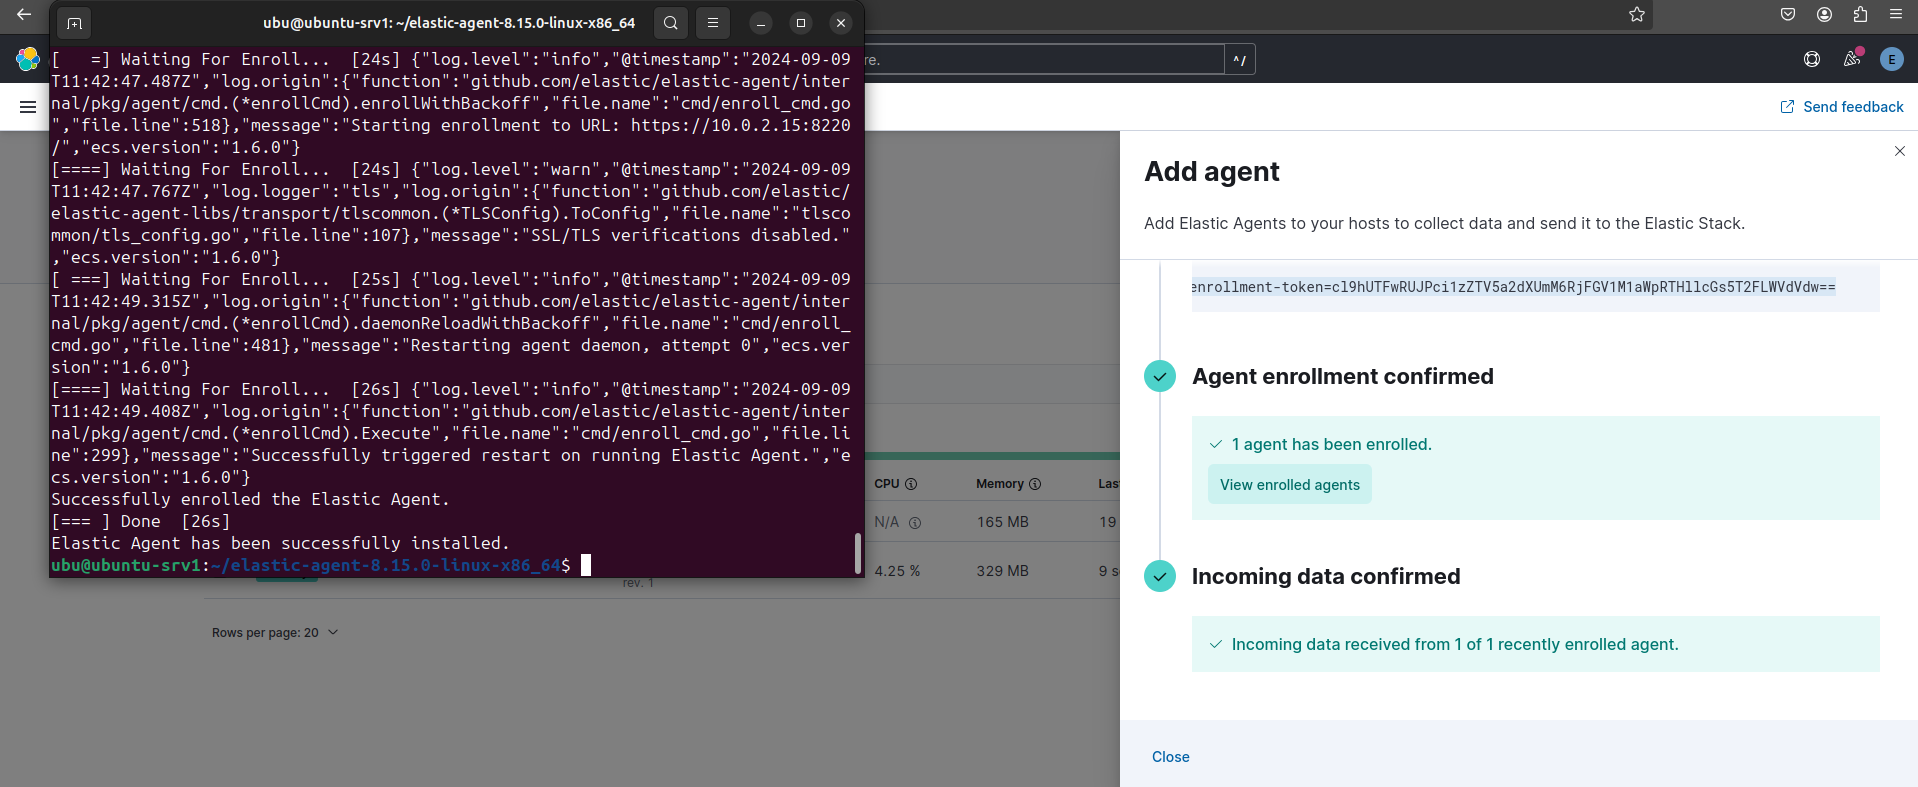
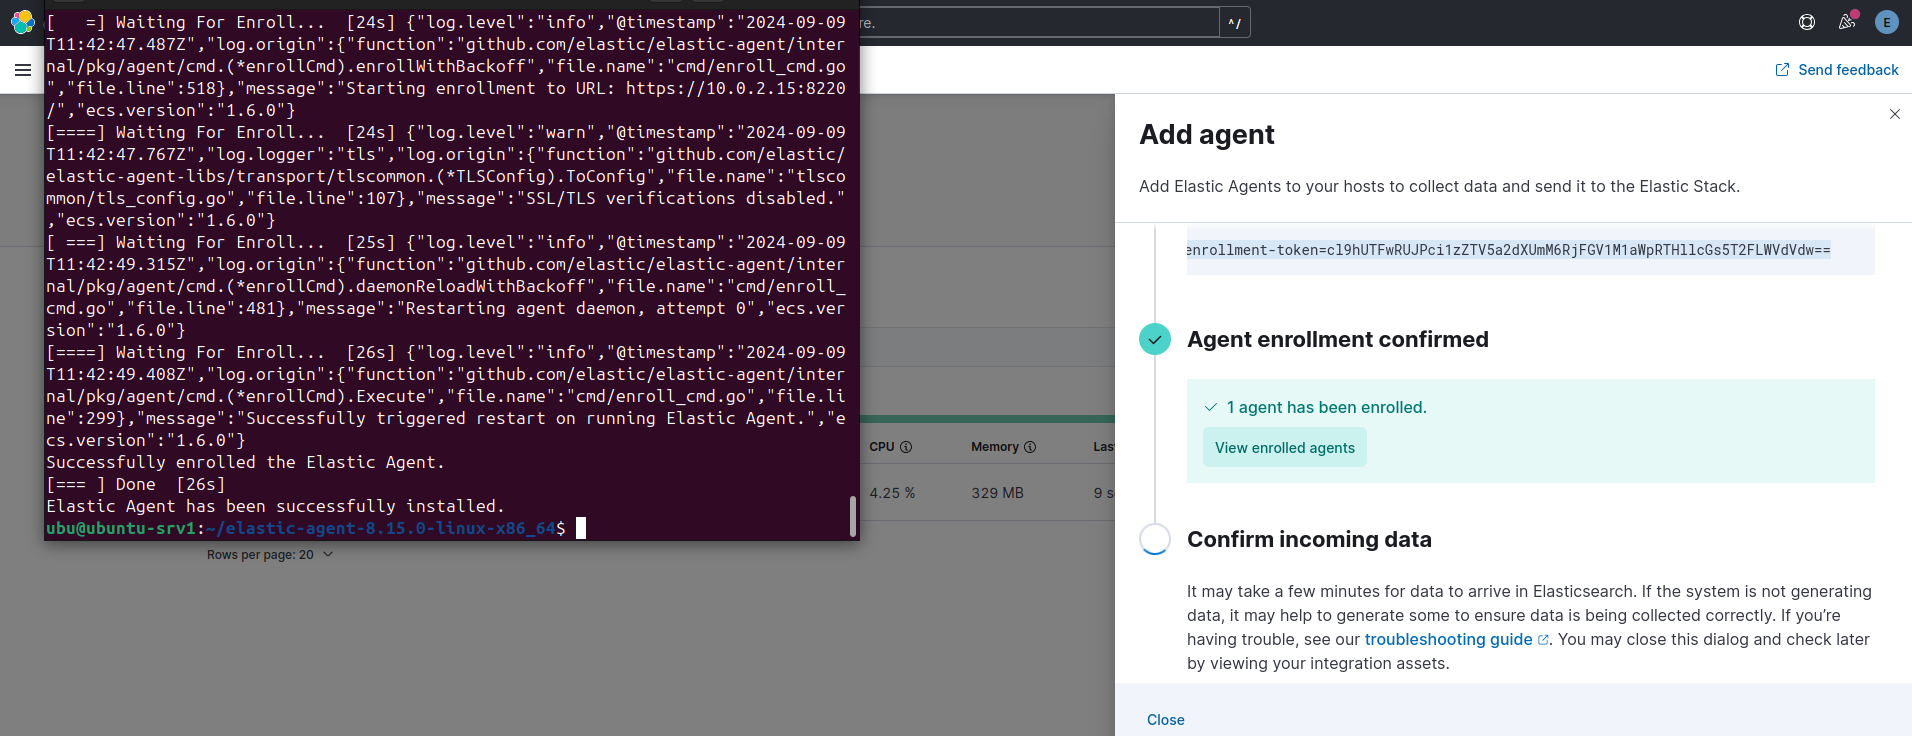 Successfully Agent Added
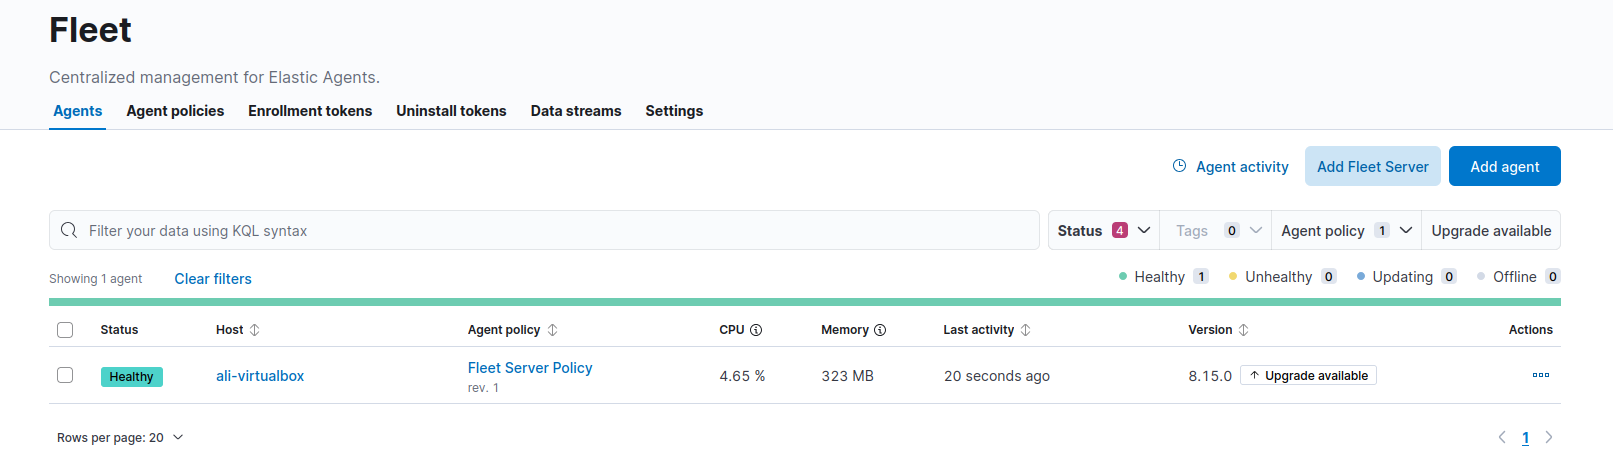
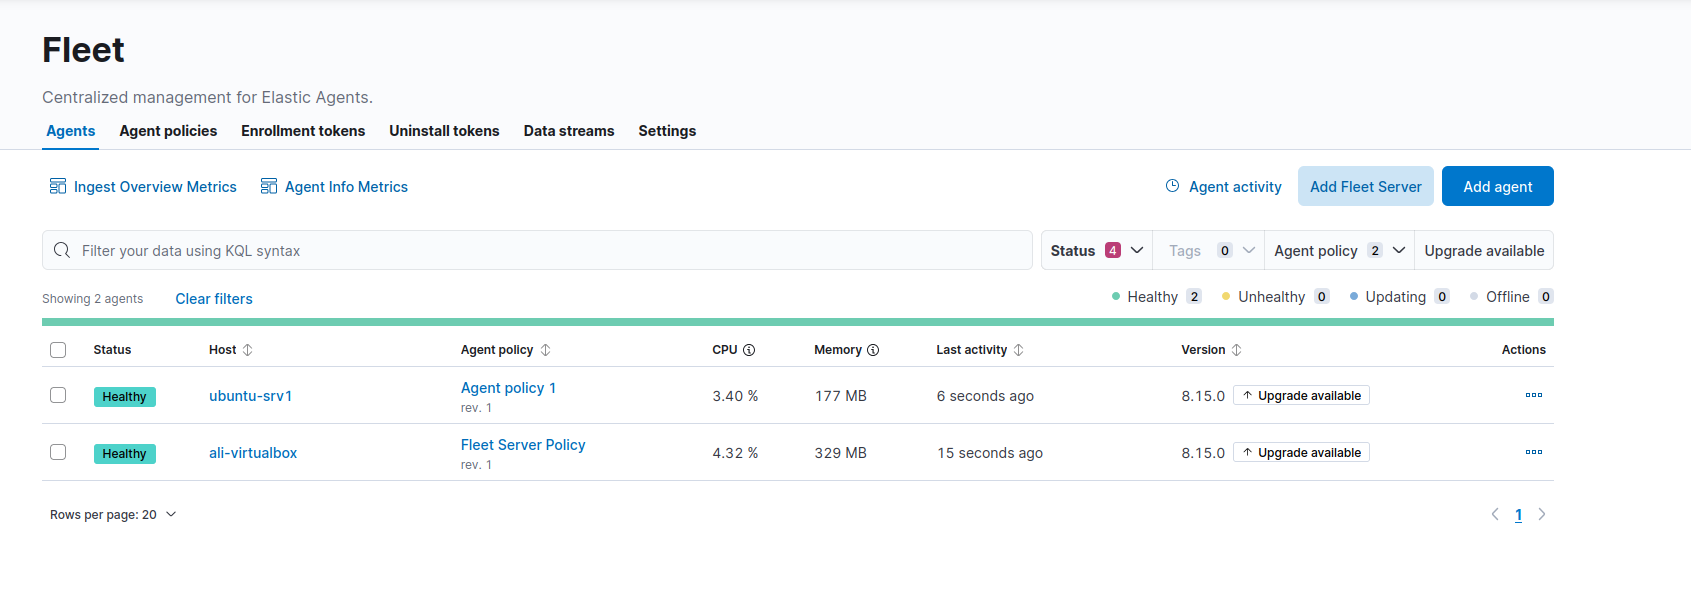
 Check installed Agents
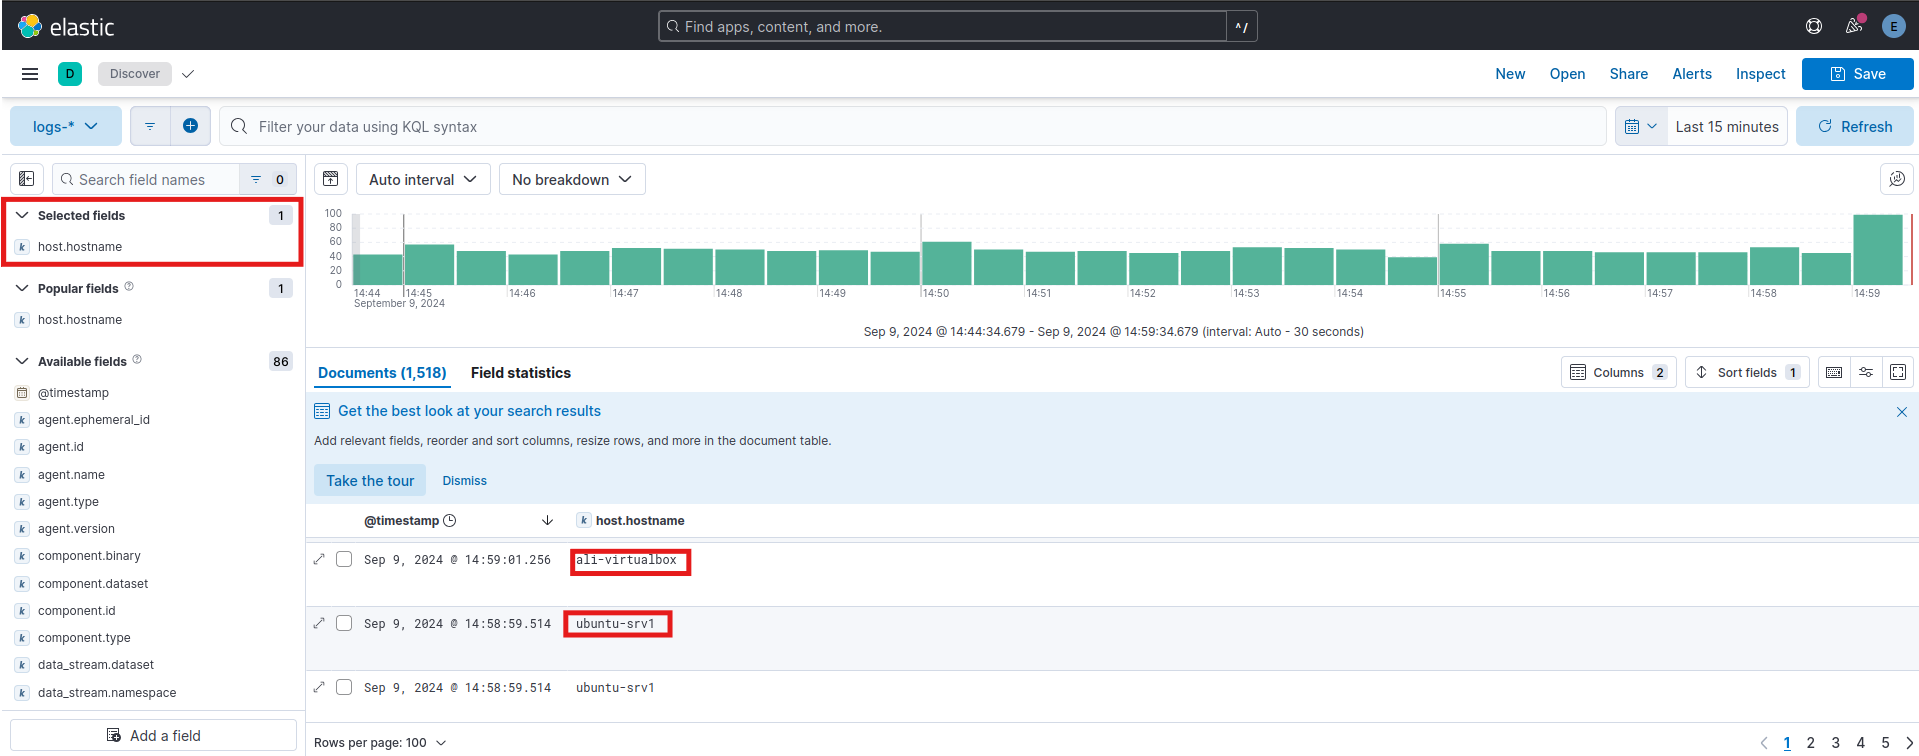
 Check Discover Tab and view logs
 By following these steps, we made it and installed Elastic Stack.
You can check the Set-up Fluent-Bit
post to learn how to set up Fluent-Bit and send logs to Elastic Stack.
By following these steps, we made it and installed Elastic Stack.
You can check the Set-up Fluent-Bit
post to learn how to set up Fluent-Bit and send logs to Elastic Stack.